Data Analytics & Dashboards

Cut through the complexities. Engage with interactive and actionable data at your fingertips.

Metrics matter. Drive impact and continuously improve by being a data-driven organization.

Use actionable information derived from your organization’s data to drilldown, analyze trends, patterns, gaps, near misses, reoccurring incidents or events, reports and more. Our decision support dashboards enable users to tailor and filter the data they want to view to their own or departmental needs. Advanced analytics at your fingertips gives your organization and hospital leadership the answers it needs.

Our interactive and visual data analysis dashboards are powerful. Not only do they give the insight needed to observe, monitor and track performance – but also to influence informed and critical decisions with instant point and click information.

Advantages of MorCare Analytics & Dashboards

Data-Driven Decision Support

Take a deep dive into your organization’s data with actionable information at your fingertips.

Optimize Outcomes

Drill-downs and filtering options allow you to view trends, analyze the data, implement change and improve process and practice.

Additional Reporting Features

In addition to customizable visual and graphic dashboards — useful crystal reports and ad hoc reporting tools are available for your reporting needs and to monitor KPIs.

About MorCare Analytics and Dashboards

Use our dashboards for a visual, deep dive analysis paired with our robust MorCare Analytics reporting tools. MorCare Analytics enhances the use of our standard dashboards by using our business intelligence report design tool to create custom, ad hoc and advanced reports and dashboards. We also integrate SAP® Crystal Reports® and SAP BusinessObjects™ Web Intelligence® for standard and ad hoc reporting.

Care Management Dashboards

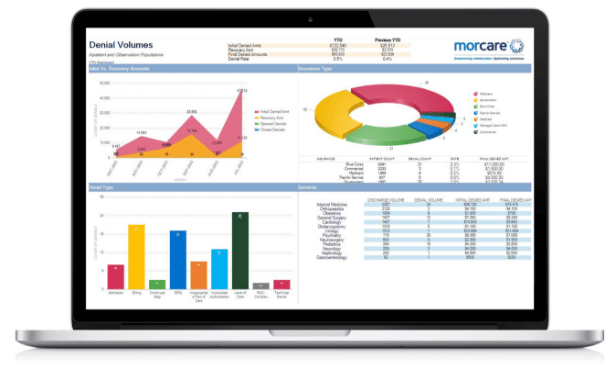
Drilldown on specifics and apply analytical findings to implement change. Our Care Management module features dashboards for UR/UM delays, physician advisor, medical necessity, LOS and denials.

Patient Safety and Risk Management Dashboards

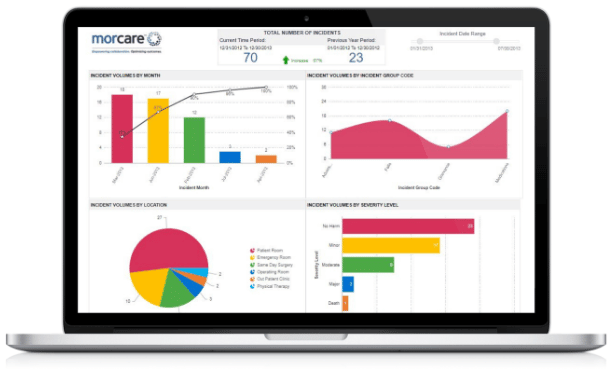
Review safety and incident types, trends, volumes, costs and more by drilling down on problematic trends and forecasting trends to reduce risk. Use MoreCare Analytics to create

Quality Management Dashboards

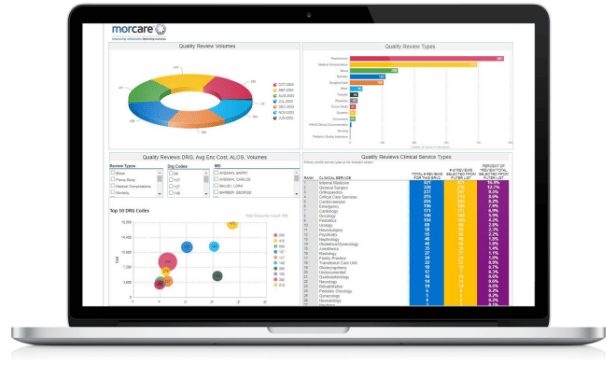
Visually see standard drilldowns such as: quality review volumes, review types, clinical service types, top DRG codes, average encounter costs, peer case review and survey management.

We have 5 elements to our Readmission Reduction Program. The use of MorCare is integral to our program and its success. For example, in the first element of our program, Assessment and Discharge Planning; it is all built into MorCare. We use this for our high-risk screening. Every patient that scores over a 6 receives a comprehensive assessment. If you use MorCare to identify patients early in their stay, developing a comprehensive evaluation will help you with your discharge planning goals.

DeVonne Grizzle, RN, MSN. CCM

Vice President of Case Management

Want to make patient transitions easier? Read this!

Enter your name and email below to download “Why Consider an Automated Solution for Care Management” and find out what you can do to streamline patient transitions at your facility.

Want to make patient transitions easier? Read this!

Enter your name and email below to download “Why Consider an Automated Solution for Care Management” and find out what you can do to streamline patient transitions at your facility.